Data Science

Tags:

Cours signalées avec « Data Science »

Quickly learn the general programming principles and methods for Python, and then begin applying that knowledge to using Python in data science-related development.

Topics include:
  • Learn the basics of Python as an object-oriented programming language.
  • Apply Python coding skills to analytics uses.
  • Explore the Python scientific stack of tools.
Catégorie: Python

With this course, gain insight into key statistical concepts and build practical analytics skills using Python and powerful third-party libraries. Instructor Michele Vallisneri covers several major skills: cleaning, visualizing, and describing data, statistical inference, and statistical modeling. All concepts are introduced by analyzing intriguing real-world datasets and discussed from a machine-learning perspective—which assumes that powerful computation can replace complex mathematics.

Topics include:
  • Installing and setting up Python
  • Importing and cleaning data
  • Visualizing data
  • Describing distributions and categorical variables
  • Using basic statistical inference and modeling techniques
  • Bayesian inference

Ce cours n´est disponible qu´en anglais. Si ce n´est pas un problème pour vous, soumettez votre demande.

Catégorie: Python

Python—the popular and highly-readable object-oriented language—is both powerful and relatively easy to learn. Whether you're new to programming or an experienced developer, this course can help you get started with Python. Joe Marini provides an overview of the installation process, basic Python syntax, and an example of how to construct and run a simple Python program. Learn to work with dates and times, read and write files, and retrieve and parse HTML, JSON, and XML data from the web.

Ce cours n´est disponible qu´en anglais. Si ce n´est pas un problème pour vous, soumettez votre demande.

Catégorie: Python

Data visualization is incredibly important for data scientists, as it helps them communicate their insights to nontechnical peers. But you don’t need to be a design pro. Python is a popular, easy-to-use programming language that offers a number of libraries specifically built for data visualization. In this course from the experts at Madecraft, you can learn how to build accurate, engaging, and easy-to-generate charts and graphs using Python. Explore the pandas and Matplotlib libraries, and then discover how to load and clean data sets and create simple and advanced plots, including heatmaps, histograms, and subplots. Instructor Michael Galarnyk provides all the instruction you need to create professional data visualizations through programming. This course was created by Madecraft. We are pleased to host this content in our library.

Topics include:
  • Use a Jupyter notebook to execute a series of commands.
  • Describe common commands to load and export data.
  • Explain pandas usage basics.
  • Modify a DataFrame using common data methods.
  • Create simple plots using Matplotlib.
  • Apply advanced techniques to produce complex plots.

Ce cours n´est disponible qu´en anglais. Si ce n´est pas un problème pour vous, soumettez votre demande.

Catégorie: Python

A sizable portion of a data scientist's day is often spent fetching and cleaning the data they need to train their algorithms. In this course, learn how to use Python tools and techniques to get the relevant, high-quality data you need. Instructor Miki Tebeka covers reading files, including how to work with CSV, XML, and JSON files. He also discusses calling APIs, web scraping (and why it should be a last resort), and validating and cleaning data. Plus, discover how to establish and monitor key performance indicators (KPIs) that help you monitor your data pipeline.

Topics include:
  • Describe the characteristics of different data types and the work of data scientists.
  • Describe different data serialization formats and explain how to use them in Python.
  • Define APIs and explain how to use them with Python to make http calls, interpret JSON, and utilize message queues.
  • Explain what web scraping is and describe ways to do it.
  • Define what a schema is and describe characteristics of schemas and how they influence operations.
  • Describe the characteristics of different types of databases.
  • Categorize types of errors and explain how to correct them.
  • Explain design criteria for data systems and describe how to monitor performance using KPIs.

Ce cours n´est disponible qu´en anglais. Si ce n´est pas un problème pour vous, soumettez votre demande.

Catégorie: Python

Modern work in data science requires skilled professionals versed in analysis workflows and using powerful tools. Python can play an integral role in nearly every aspect of working with data—from ingest, to querying, to extracting and visualizing. This course highlights twelve tips and tricks you can put into practice to improve your skills in Python. These techniques are readily applied and in common data management tasks and include the following: how to ingest data using CSV, JSON, and TXT files; how to explore data using libraries like Pandas; how to organize and join data using DataFrames; how to create charts and graphic representations of data using ggplot in Python; and more.

Ce cours n´est disponible qu´en anglais. Si ce n´est pas un problème pour vous, soumettez votre demande.

Catégorie: Python

Data science is transforming the way that government and industry leaders look at both specific problems and the world at large. Curious about how data analysis actually works in practice? In this course, instructor Michele Vallisneri shows you how, explaining what it takes to get started with data science using Python. Michele demonstrates how to set up your analysis environment and provides a refresher on the basics of working with data structures in Python. Then, he jumps into the big stuff: the power of arrays, indexing, and tables in NumPy and pandas—two popular third-party packages designed specifically for data analysis. He also walks through two sample big-data projects: using NumPy to identify and visualize weather patterns and using pandas to analyze the popularity of baby names over the last century. Challenges issued along the way help you practice what you've learned. Note: This version of the course was updated to reflect recent changes in Python 3, NumPy, and pandas.

Ce cours n´est disponible qu´en anglais. Si ce n´est pas un problème pour vous, soumettez votre demande.

Catégorie: Python

Python for Data Science Essential Training is one of the most popular data science courses at LinkedIn Learning. It has now been updated and expanded to two parts—for even more hands-on experience with Python. In this course, instructor Lillian Pierson takes you step by step through a practical data science project: a web scraper that downloads and analyzes data from the web. Along the way, she introduces techniques to clean, reformat, transform, and describe raw data; generate visualizations; remove outliers; perform simple data analysis; and generate interactive graphs using the Plotly library. You should walk away from this training with basic coding experience that you can take to your organization and quickly apply to your own custom data science projects.

Topics include:
  • Why use Python for working with data
  • Filtering and selecting data
  • Concatenating and transforming data
  • Data visualization best practices
  • Visualizing data
  • Creating a plot
  • Creating statistical data graphics
  • Performing basic math and linear algebra
  • Correlation analysis
  • Multivariate analysis
  • Data sourcing via web scraping
  • Introduction to natural language processing
  • Collaborative analytics with Plotly

Ce cours n´est disponible qu´en anglais. Si ce n´est pas un problème pour vous, soumettez votre demande.

Catégorie: Python

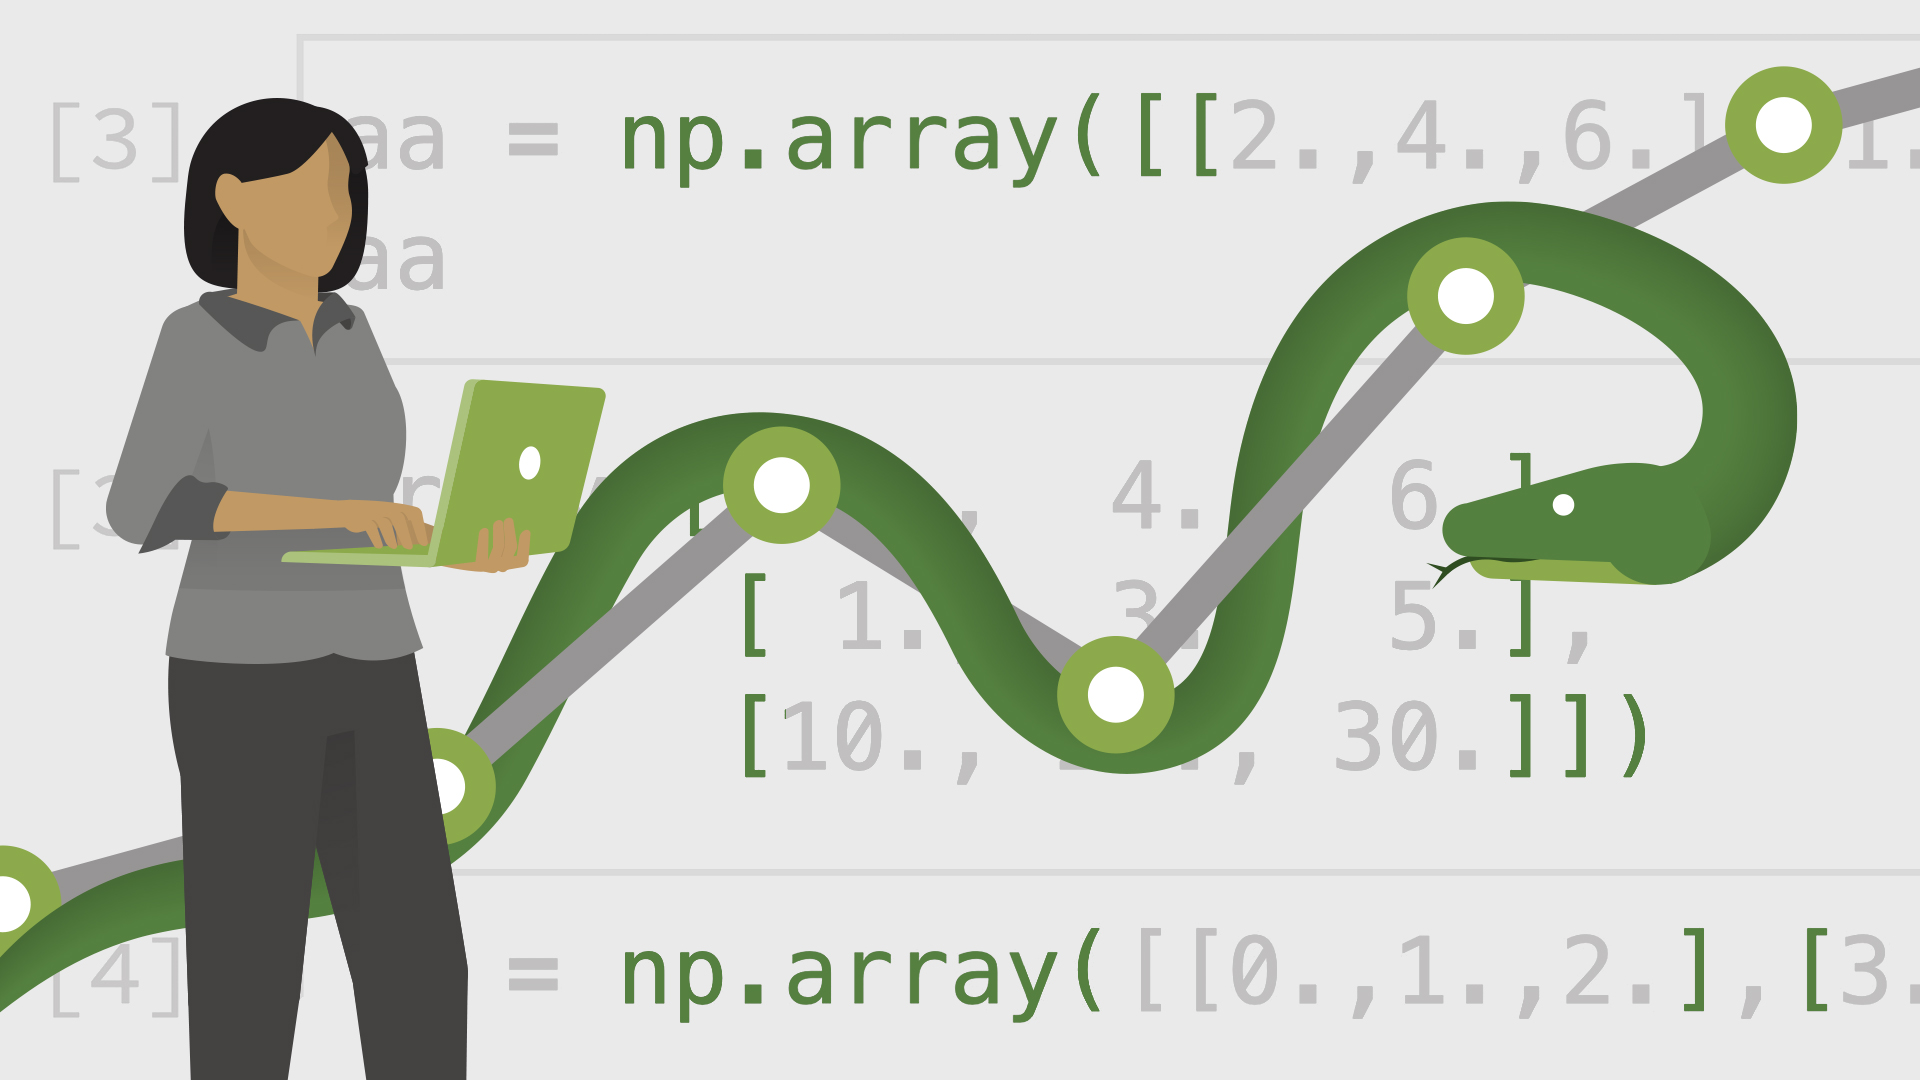
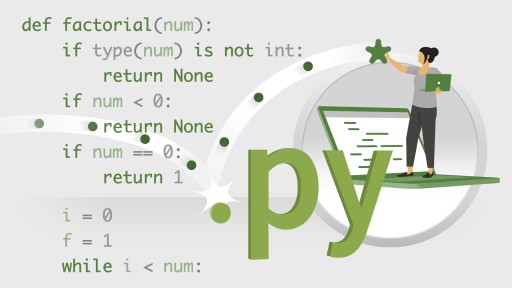
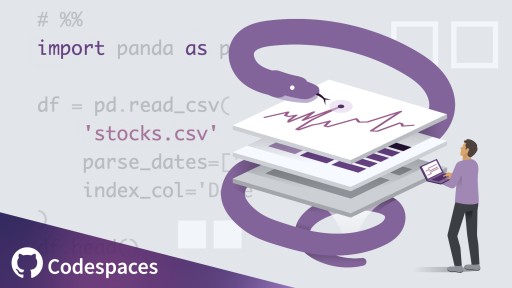
Python is one of the most commonly used dynamic languages for many large organizations, including Google, Yahoo and IBM. Supported on all major operating systems, it comes pre-installed on Macs, as well as most Linux and Unix-based systems. In this course, senior software engineer Ryan Mitchell guides you through all the essentials of learning and using Python. Learn how computers think, as well as how to install Python, pip, and Jupyter Notebook and the basics of writing a program. Explore variables and types, operators, functions, classes, objects, and more. Go over basic data types like ints and floats, Booleans, and strings. Deep dive into basic data structures, control flow, functions, classes, and objects. Find out how to handle errors and exceptions, as well as threads and processes. Plus, discover how to work with different types of files in Python, pass command-line arguments to your Python script, and create modules and packages.

Ce cours n´est disponible qu´en anglais. Si ce n´est pas un problème pour vous, soumettez votre demande.

This course is in French only. If this is not a problem for you, by all means go ahead and apply.

Catégorie: Python

Python for Data Science Essential Training is one of the most popular data science courses at LinkedIn Learning. It has now been updated and expanded to two parts—for even more hands-on experience with Python. In this course, instructor Lillian Pierson takes you step by step through a practical data science project: building machine learning models that can generate predictions and recommendations and automate routine tasks. Along the way, she shows how to perform linear and logistic regression, use K-means and hierarchal clustering, identify relationships between variables, and use other machine learning tools such as neural networks and Bayesian models. You should walk away from this training with hands-on coding experience that you can quickly apply to your own data science projects.

Topics include:
  • Why use Python for data science
  • Machine learning 101
  • Linear regression
  • Logistic regression
  • Clustering models: K-means and hierarchal models
  • Dimension reduction methods
  • Association rules
  • Ensembles methods
  • Introduction to neural networks
  • Decision tree models

Ce cours n´est disponible qu´en anglais. Si ce n´est pas un problème pour vous, soumettez votre demande.

Catégorie: Python

Join instructor Miki Tebeka as he dives into the Python scientific stack and shows you how to use it to solve problems. Miki covers the major packages used throughout the data science process: numpy, pandas, matplotlib, scikit-learn, and others. He also guides you through how to load data, analyze data, run models, and display results. This course is integrated with GitHub Codespaces, an instant cloud developer environment that offers all the functionality of your favorite IDE without the need for any local machine setup. With GitHub Codespaces, you can get hands-on practice from any machine, at any time—all while using a tool that you’ll likely encounter in the workplace. Check out the “Using GitHub Codespaces with this course” video to learn how to get started.

Ce cours n´est disponible qu´en anglais. Si ce n´est pas un problème pour vous, soumettez votre demande.

This course is in French only. If this is not a problem for you, by all means go ahead and apply.

Catégorie: Python

SCORE 4/5 by Smals Colleagues

Le diagramme de classes UML (Unified Modeling Language) peut convenir parfaitement à la modélisation d’une base de données. Avec votre formateur Christian Soutou, vous découvrirez tous les mécanismes à adopter afin de construire vos modèles relationnels d’une manière optimale et de générer vos scripts SQL. Vous pourrez appliquer ces principes à n’importe quel système de gestion de base de données (SGBD) du marché (Oracle, SQL Server, DB2, MySQL, PostgreSQL, etc.). Cette formation suit les niveaux du processus de conception d’une base de données. Elle présente aussi méthodiquement les concepts et les solutions de chaque étape. Que vous soyez développeur, analyste ou chef de projets, découvrez UML sous un autre jour !

This course is in French only. If this is not a problem for you, by all means go ahead and apply.

Catégorie: UML