Excel information resources

Course duration: 4,34h
VBA allows you to automate routine tasks in Excel, and it's easier to learn than you might think. In this course, Excel expert Curt Frye presents a thorough introduction to the Visual Basic for Applications programming language. Learn how to create subroutines and functions to hold code, and gain a solid grounding in the Excel object model. Explore programming techniques through real-world examples and the exercise files that accompany the course. Find out how to work with the Visual Basic Editor, add code to a macro, and create, export, and delete code modules. Go over declaring and using variables, managing variable scope, and defining arrays. Discover ways to use VBA to manage your workbooks and spreadsheets. Learn how to simplify repeating tasks with loops and debug VBA code. Practice cutting, copying, and pasting cell data, as well as running and triggering event procedures. Plus, use practical challenges to apply what you’ve learned.
Topics include:
- Identify components of objects.
- Define VBA terminology.
- Describe the steps taken when writing VBA code.
- Explain the purpose of breakpoints in VBA code.
- Review how to apply macros with VBA.
- Explore the process of searching through an Excel worksheet with VBA.
This course is in French only. If this is not a problem for you, by all means go ahead and apply.

Excel, the popular spreadsheet program from Microsoft, is an essential tool for many professional roles. In this course, Jess Stratton shows you the ins and outs of the 2021 release. Jess begins with how to navigate Excel and how to create, open, and save a file. Next, she shows you how to enter, format, autofill, and edit text, as well as how to copy and delete cell data, merge cells, and more. Jess explains how to work with sheets, then dives into the myriad adjustments and customizations you can apply to rows and columns. Formulas are at the heart of Excel’s ability to perform text or number calculations, so Jess concludes by walking you through formulas and functions, including AutoSum and the very useful XLOOKUP.
Topics include:

Utilisez Excel pour simplifier la compréhension de vos données commerciales. Nicolas Georgeault, MVP Office Server and Applications, vous présente ce cours pour vous aider à bâtir une solution simple et efficace qui facilite les prises de décision. De la conception du tableau de bord jusqu'à sa réalisation, vous apprendrez les bonnes pratiques afin d'exploiter efficacement les outils d'aide à la décision comme Power Pivot et Power Query. Ainsi, vous serez en mesure de tirer parti des possibilités graphiques et des tableaux croisés dynamiques pour élaborer votre stratégie commerciale.
Topics include:
Deze cursus is enkel beschikbaar in het Engels. Als dit voor u geen probleem vormt, dien dan gerust uw aanvraag in.
This course is in French only. If this is not a problem for you, by all means go ahead and apply.

Dans cette formation, vous allez apprendre à tirer parti des macrocommandes et du langage de programmation VBA d'Excel, le tableur de Microsoft. Martial Auroy vous propose d'abord de mettre en place une méthode de travail, notamment en ce qui concerne la préparation des projets. Puis, au fur et à mesure des chapitres vous procéderez, toujours avec des exemples concrets, à la planification puis à l'exploitation des données. Vous aborderez également d'autres cas d'utilisation que vous rencontrerez certainement au quotidien, comme l'ouverture du navigateur web à partir d'une cellule, l'envoi d'informations par e-mail ou encore le paramétrage en vue de l'impression.
Topics include:
Deze cursus is enkel beschikbaar in het Engels. Als dit voor u geen probleem vormt, dien dan gerust uw aanvraag in.
This course is in French only. If this is not a problem for you, by all means go ahead and apply.

Course duration: 0,62h
Un graphique vaut mieux que des tableaux illisibles. Dans cette formation sur Excel, Alexandra Beauchamps, vous rend simple ce qui est compliqué. Vous allez apprendre à illustrer des informations chiffrées à l'aide d'un graphique afin de faire parler vos données. Vous allez aussi découvrir comment créer votre graphique et l'adapter au message que vous voulez faire passer. Vous allez notamment voir comment ajouter un titre ou une légende, paramétrer des étiquettes de données ou gérer des plages de données complexes.
Topics include:
This course is in French only. If this is not a problem for you, by all means go ahead and apply.

Comment gagner du temps dans la collecte et le traitement de vos données ? Pourquoi ne pas vous aider d'outils pratiques pour analyser efficacement vos éléments ? Dans ce cours, Aurélien Delaux vous explique comment utiliser Excel avec Office 365 pour fiabiliser vos données, les analyser facilement et éviter les erreurs courantes. Ensemble, vous aborderez quelques outils avancés tels que le filtrage par zone de critères, les valeurs cibles et les tableaux croisés dynamiques․ Cela vous permettra d'exploiter le meilleur de vos bases de données pour prendre des décisions plus pertinentes, plus facilement et plus précisément.
Topics include:
Deze cursus is enkel beschikbaar in het Engels. Als dit voor u geen probleem vormt, dien dan gerust uw aanvraag in.
This course is in French only. If this is not a problem for you, by all means go ahead and apply.

While the power and time-saving value of PivotTables appeals to anyone who analyzes data in Excel, many users are too intimidated by the feature to add it to their workflow. In this course—the first installment in a two-part series—instructor Chris Dutton breaks down how to use PivotTables, as well as how to add PivotCharts to the mix to summarize your data visually. Throughout the course, Chris shares practical tips and demonstrations that help you grasp how these tools are used in the real world, as well as how PivotTable values are actually calculated and displayed. Learn how to prepare your raw data for analysis; leverage formatting, sorting, filtering, and grouping options; display values in multiple ways; create PivotCharts; and much more.
Topics include
- Establishing a layer convention and property filters
- Structuring your source data
- How PivotTables actually work
- Number formatting and conditional formatting
- Sorting and grouping options
- Troubleshooting incorrect sorting
- Value summarization and value calculation modes
- Inserting calculated items
- Visualizing data with PivotCharts
- Designing interactive dashboards
Deze cursus is enkel beschikbaar in het Engels. Als dit voor u geen probleem vormt, dien dan gerust uw aanvraag in.
This course is in French only. If this is not a problem for you, by all means go ahead and apply.

Once you grasp the basics of Excel PivotTables, you're ready to see how this powerful data analysis tool can add value in real-world situations. In this course— the final installment in a two-part series—instructor Chris Dutton dives into ten real-world case studies that showcase how PivotTables can be leveraged to explore and analyze data in a variety of situations. While the previous installment in this series dove into theory and the general ins and outs of PivotTables, this course helps expand your knowledge by looking at practical applications of the tool. Chris covers case studies on San Diego burrito ratings, historical shark attack records, major league baseball statistics, stock market data, and more.
Topics include:
Deze cursus is enkel beschikbaar in het Engels. Als dit voor u geen probleem vormt, dien dan gerust uw aanvraag in.
This course is in French only. If this is not a problem for you, by all means go ahead and apply.

Excel power users: Learn how to use Excel and Visual Basic for Applications (VBA) to create and run simulations of business processes for customer flow, queuing, and manufacturing. VBA exponentially extends the power of Excel, allowing you to control process flow and logic and add custom classes and variables. In this course, Curt Frye demonstrates how to build simulations of increasing complexity, which model the flow of customers through a multi-station process. Learn how to calculate arrival times, add customers, increase individual station capacity, and enable conditional station paths. At the end of the course, Curt shows how to convert output to an Excel table and analyze the results of your simulation.
Topics include
- Creating a class module in VBA
- Defining class properties
- Creating collections
- Describing process flow and programming goals
- Creating loops
- Increasing capacity of a model
- Running simulations
- Analyzing simulation results
Deze cursus is enkel beschikbaar in het Engels. Als dit voor u geen probleem vormt, dien dan gerust uw aanvraag in.
This course is in French only. If this is not a problem for you, by all means go ahead and apply.

In this course, instructor Curt Frye shows you how to summarize spreadsheet data effectively to support decision-making throughout your organization. Curt explains how to set up a supporting workbook, including how to manage and filter data, streamline charts for dashboards, and create sparklines. He also goes over the process of creating a dashboard worksheet. Curt covers creating and managing cell links, using PivotTable data in a formula, extending your dashboard with hidden rows, and more.
Topics include:
- Managing data using Excel tables
- Managing PivotTables and PivotCharts
- Summarizing table and PivotTable data
- Defining conditional formats
- Creating sparklines
- Sketching your dashboard layout
- Creating and managing cell links
- Linking cell contents to a shape
- Linking to a PivotTable cell
- Extending your dashboard using hidden rows
Deze cursus is enkel beschikbaar in het Engels. Als dit voor u geen probleem vormt, dien dan gerust uw aanvraag in.
This course is in French only. If this is not a problem for you, by all means go ahead and apply.
Course duration: 0,45h
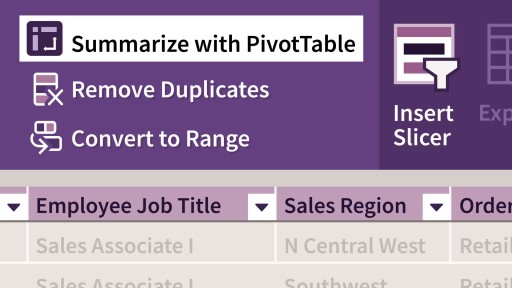
PivotTables don't have to be scary! This powerful Excel feature cuts the time you spend on formulas in half. In this concise course, Excel trainer Dave Ludwig demystifies PivotTables and shows you how to get started using them to analyze your data. Dave begins by explaining two PivotTable basic building blocks: value fields and row fields. Then he shows you how to adjust a PivotTable by adding fields, filters, and formatting. Dave shows you how to use special filter buttons which are known as slicers, and he also demonstrates how to use timelines. Plus, he goes over the basics of refreshing and updating a PivotTable. Finally, he’ll show you how to use AI in Excel to generate PivotTables automatically for you.
Deze cursus is enkel beschikbaar in het Engels. Als dit voor u geen probleem vormt, dien dan gerust uw aanvraag in.
This course is in French only. If this is not a problem for you, by all means go ahead and apply.

Automate complex tasks and get more meaningful insights from data in Excel using Visual Basic for Applications (VBA) code. This course demonstrates how to work more efficiently in this powerful and popular spreadsheet program. Curt Frye shows how to focus in on important data, with filters; manage workbooks and worksheets; access built-in functions; create charts; build UserForm interfaces for data entry; and manage PivotTables using Excel VBA.
Topics include:
- Why test-driven development matters
- Test planning for @Service, @Controller, and @Repository components
- Writing integration tests for @Service, @Controller, and @Repository components
- Writing unit tests for @Service, @Controller, and @Repository components
- Creating integration test datasets
- Making a feature test suite
- Making a continuous integration test suite
Deze cursus is enkel beschikbaar in het Engels. Als dit voor u geen probleem vormt, dien dan gerust uw aanvraag in.
This course is in French only. If this is not a problem for you, by all means go ahead and apply.
Course duration: 3,88h
PivotTables are one of the most powerful features in Excel, yet many users are barely scratching the surface of what they can do. In this course, Excel power user Curt Frye shows you how to navigate the complexity of PivotTables while taking advantage of their power. Curt explains how to build PivotTables from single or multiple data sources, pivot and configure a PivotTable, define a default PivotTable layout, and more. He demonstrates ways to summarize your data, add calculated fields, filter your results, and format your layout to make it more readable. Learn how to sort and filter PivotTable data, format your PivotTable, and apply conditional formats. Curt also explains how to create PivotCharts to visualize your data, enhance PivotTables with macros, and use the Data Model feature to build PivotTables from related tables. Note: This course was recorded in Microsoft 365. However, anyone using a recent standalone version of Excel (Excel 2021, 2019, or 2016) should be able to follow along with the course contents.
Topics include:
- Determine when it is necessary to click Defer Layout Update in the fields area.
- Recall the easiest way to create a PivotTable from external data that cannot be imported directly as an Excel table.
- Explain the configuration that takes up the least width on the screen while keeping the Fields List area visible.
- Identify the mistake users often make when creating filters.
- Explore the function of slicers.
- Review the use of data bars with a PivotTable.
- Name the first step in viewing all the conditional rules applied to a PivotTable.
- Recognize the appropriate way to save a macro.
This course is in French only. If this is not a problem for you, by all means go ahead and apply.

The most common questions about using Excel now have timely video answers. This set of quick tips offers helpful, condensed steps you can readily apply to keep on task—whether you're running calculations, setting up a new workbook, applying conditional formatting, fixing a sheet, collaborating with your team, removing sensitive information from a file, getting tables ready for a presentation, and more. Join LinkedIn Learning staff instructor Garrick Chow as he provides on-the-spot solutions for some of the most common questions in Excel. Each video is about one minute long, so you can jump in and get some helpful insights in no time.
Topics include:
Deze cursus is enkel beschikbaar in het Engels. Als dit voor u geen probleem vormt, dien dan gerust uw aanvraag in.
This course is in French only. If this is not a problem for you, by all means go ahead and apply.
Did you know you can use Excel to create a simple database and get even more insights into your data? Join instructor Dennis Taylor and learn how to create a simple database. Dennis explains how to prepare lists that are suitable for data analysis. He goes into how to use the Form tool to view and manage records in a list, then covers how to use the Data Validation command to enter data quickly and accurately. Dennis steps through how to convert data to a table and use its many valuable features. He discusses the Table Design tab, demonstrating how to access the many formatting features to apply to tables. He demonstrates how to expand tables quickly and easily by adding adjacent rows and columns, as well as total rows. Dennis highlights some techniques for creating formulas using field names. He concludes by showing you how to use slicers to filter data with appealing, easy-to-read visuals.
Topics include:
Deze cursus is enkel beschikbaar in het Engels. Als dit voor u geen probleem vormt, dien dan gerust uw aanvraag in.
This course is in French only. If this is not a problem for you, by all means go ahead and apply.

Course duration: 2,95h
Get up to speed with Microsoft Excel, the world's most popular spreadsheet program. Follow along with Excel expert Dennis Taylor as he demonstrates how to efficiently manage and analyze data with this powerful program. Learn how to enter and organize data, perform calculations with simple functions, and format the appearance of rows, columns, cells, and data. Plus, learn about accessibility features, how to work with multiple worksheets, build charts and PivotTables, sort and filter data, print in Excel, use Microsoft Copilot with Excel, and more.
Topics include:
- Describe the process for adding a command to the Quick Access toolbar.
- Cite the shortcuts for Undo and Redo.
- Name the keys commonly used to move, copy, and insert data.
- Explain how to create a chart.
- Summarize the process for freezing and unfreezing panes.
- Describe methods for sorting data.
- Explain how to create Pivot Tables.
This course is in French only. If this is not a problem for you, by all means go ahead and apply.